If you’re familiar with AdWords and you’re looking to learn some techniques that can help you to more fully analyze your PPC data, this is the guide for you!
One of the many advantages that Paid Advertising provides in general is the data. Compared to SEO data, PPC data is often more accurate, larger in quantity and more complete. However, as a consequence, you may find yourself in ‘analysis paralysis’, where you have so much data that you don’t know what to look at.
My experience over the last ten years in Search has provided me with a set of analytical tools that have proved invaluable when addressing a problem or question. The more tricks and tools you have in your analytical arsenal the easier you will find it to address your data.
In this guide you will learn a few simple tricks and techniques to help you analyze your PPC data.
1. Excel is Your Friend!
I cannot understate how important it is to get a firm grip on the formulas and functionality of Excel. Unless you are a programmer of some kind, Excel should be your best friend when considering PPC data. All the following tricks will use Excel, so by the end of this guide you should have some really useful formulas that you can start to think about applying to other tasks.
2. Weighting Data for Averages
This is something I use a lot, not just in PPC but in a range of data analysis. This is best explained with an example; if we assume you have a set of keywords and you want to know the average position for them, there are two ways you can address this:
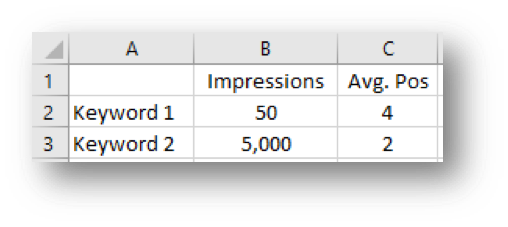
- The first is to take an average of the positions of each keyword. If we take a very simple example of just two keywords, one of them had 50 impressions in an Average Position of 4 and the other had 5,000 impressions in an Average Position of 2. In this example, we would have an Average Position of 3. But what we are looking at here is the average position of the ‘keywords’. 3 as the average position doesn’t really make sense as 99% of the time the impressions have an average position of 2. There are reasons for looking at the average position using either the above or below methodologies, but the below will give you a better and more accurate view of ‘average position’.
- The second and more accurate way to determine the average position of the keywords is to determine the average position of our ‘ads’ are for these keywords, via using a ‘weighted average’average. Excel is the best place to calculate this kind of thing; the screenshot below shows the simplest example of the data:
Step 1: The first step is to add a formula into cell D2, where we multiply cells B2 & C2:
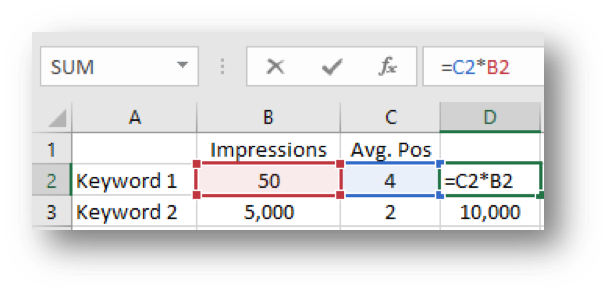
In the screenshot above, we can see the formula shown in cell D2 and see the result in cell D3 for the next row. If you had more than two keywords you would simply copy this formula down for each keyword.
Step 2: Now we need to add up the values for column B and column D. We do this by using a =sum() formula:
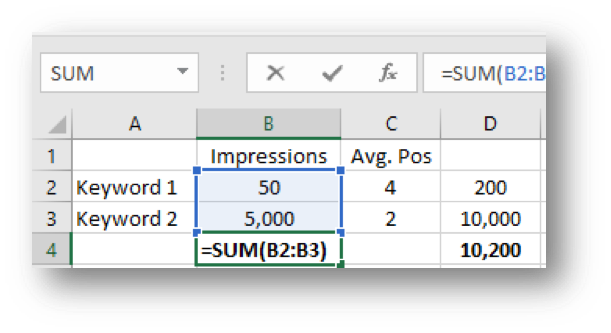
We have copied this formula to cell D4 in the above example. This looks like the following without the formulas:
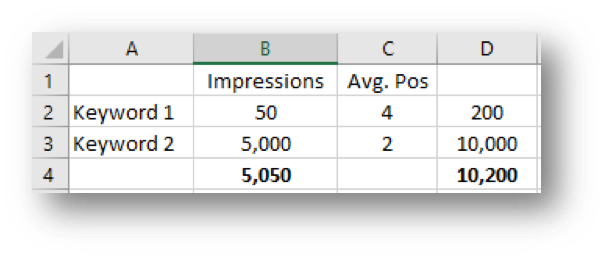
Step 3: All that is left to do here is divide the value in cell D4 by the value in cell B4:
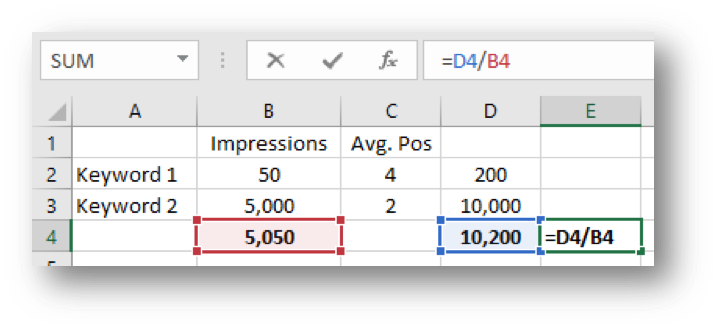
In this case we get 2.02 as the answer to the question ‘what is the average position of the impressions?’
You can apply this to other things like ‘competition’ of ‘keyword difficulty’ metrics for keywords. If you have a set of keywords where one of those keywords contains say 80% of the total search volume; when working out the average competition it would be more accurate to weight it by search volume. In this example, we are looking at either the competition of the keywords or the actual searches being performed.
3. ROI / ROAS Bidding Formula
Depending on what your business calls ROI (Return on Investment) or ROAS (Return on Ad Spend), you may be targeted on this or be aiming for a specific ROI. Although you will need to test and measure the effectiveness of this technique, on very large accounts you will often need to a formulaic approach to bidding.
ROI
As with almost anything in AdWords there are usually a load of dependant or derived metrics from any one metric. ROI is a great example of this, to calculate ROI, we divide the revenue by the cost, which in AdWords is often the ‘conversion value’ and ad spend also known as ‘cost’.
Cost is derived from the cost per clicks (CPCs) of your clicks and revenue is derived from the value of the conversions received. Therefore, broadly speaking, the higher the CPC the lower the ROI (if we assume all other variables stay the same). In the table below, we show an example of increasing CPC that results in increased traffic from improved position:
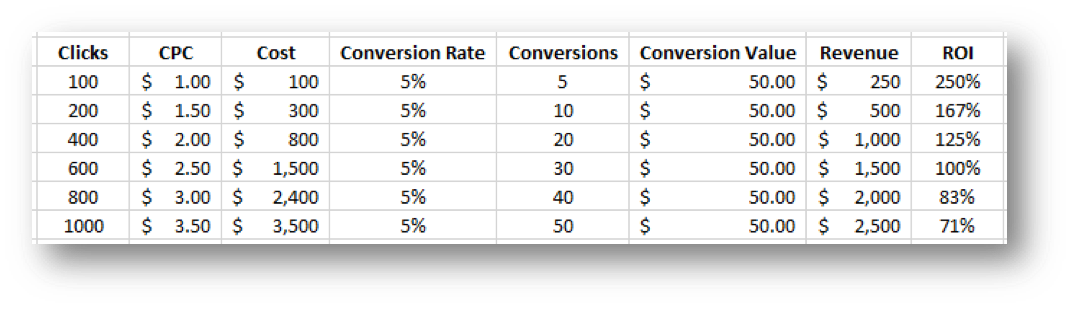
It’s important to note that the ROI will not be changed by adjusting the ‘Clicks’, regardless of the number of clicks the ROI will remain the same.
Now, in reality, there are other variables like the higher your position often your conversion rate may increase, which will need to be analyzed and considered when using formulaic bidding methods.
Example
Let’s assume you have an ROI target of 150% and you are achieving an ROI of 180%, meaning you can afford to raise bids where the average position can be improved. How do we calculate this increase in CPC?
Actual ROI / Target ROI
1.8 / 1.5 = 1.2
This means that we need to multiply the current bid by 1.2 (or add 20%) in order to bring ROI down to target. The formula for this as a whole is as follows:
(Actual ROI / Target ROI) x Current Bid = New Bid (on ROI target)
Things to Note
There are few important things to note before going ahead and applying this to your whole account:
- You need enough data to make a decision – Components with just one Click or one Conversion are not providing enough data to make a decision.
- Be as granular as possible – Applying a multiple across the whole account is not going to help, you should manage this at the ad group or keyword level.
- Exclude keywords with no revenue.
- Exclude keywords that cannot improve their average position.
What you will also find is that the higher your average position the lower the returns will be in Clicks when increasing CPC. When your average position is 5 a small increase in CPC can sometimes produce a disproportionate increase in traffic. Conversely, when your average position is 1.8, you might need a large increase in CPC to move up a few 10ths of a position.
You need to monitor the changes in ROI as well as profit (revenue – cost). You may find that the increase in Clicks is insignificant but the increase in cost isn’t!
Below, we show two examples; in the first, we see an increase in CPC that results in an increase in profit and a decrease in ROI. This is because the Clicks increased sufficiently to deliver enough conversions to increase profits. CPC increased to 150% but Clicks increased to 200%, resulting in +33% profits.
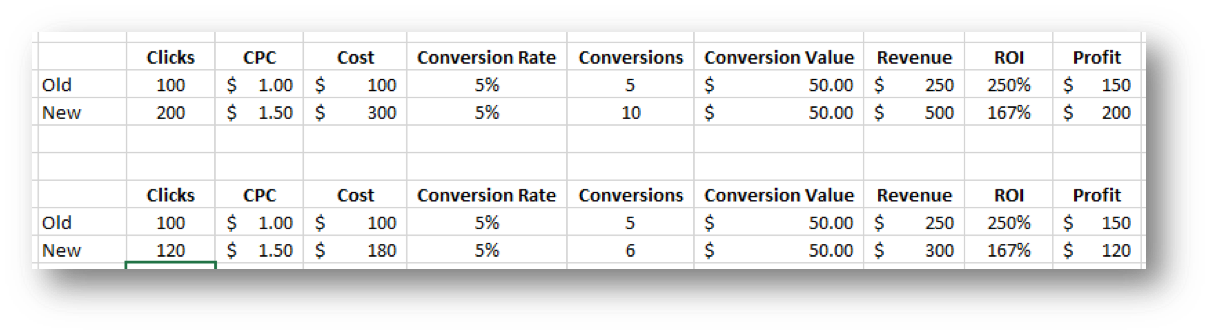
In the second example (the bottom rowa) we see that the increase in Clicks was only 20%, whereas the increase in CPC was 50%, which resulted in profits reducing by 20%.
4. Labeling and Excel
Labels are one of the least used, most underrated and often poorly utilized features of AdWords. You can add labels to each keyword, ad, ad group and campaign in order to make your labeling as granular as you like. Moreover, you can add multiple labels to any of those components!
This is incredibly valuable when reporting on or analyzing performance of the account and its constituent parts as it allows for easy segmentation.
There are many reasons you might want to label components that are not already accounted for, such as brand vs non-brand or channel (remarketing, RLSA, Search, Display, Video, etc).
If you have an account with a range of different products or product categories, or indeed a varied range of any offerings, you can label components with those products.
You may also want to label your ‘head terms’ and your ‘low value terms’ based on the commercial intent or search volume. In short, there are too many labels to mention, but you should get the idea.
Things you need to know:
- Labels must be consistent (don’t use ‘head term’ on one component and ‘head terms’ on another if they are both the same thing)
- Keep a concise list of all labels used in the account and at which level they are used (keyword, ad group, etc)
- Ensure that all components are labeled, missing components will result in loss of data / missing data (when adding new components, ensure that labeling them is part of the build process)
- AdWords will automatically sort labels for anyone component alphabetically (so don’t assume that they will keep the order in which you add them)
- Labels are not kept in a historical record (if you add, change or remove a label it will apply to all of the historical data for that component)
Segmentation
We will do this in Excel with a range of formulas, I will also show you how to do this in a very structured way that means you can simply export new data into a tab, and the analysis/segmentation will update automatically.
There are 4 tabs in the spreadsheet:
- Advanced (this if for the next section on advanced segmentation)
- Analysis (contains the interesting stuff)
- Data (this is an export from AdWords)
- Labels (This is a concise list of all labels used)
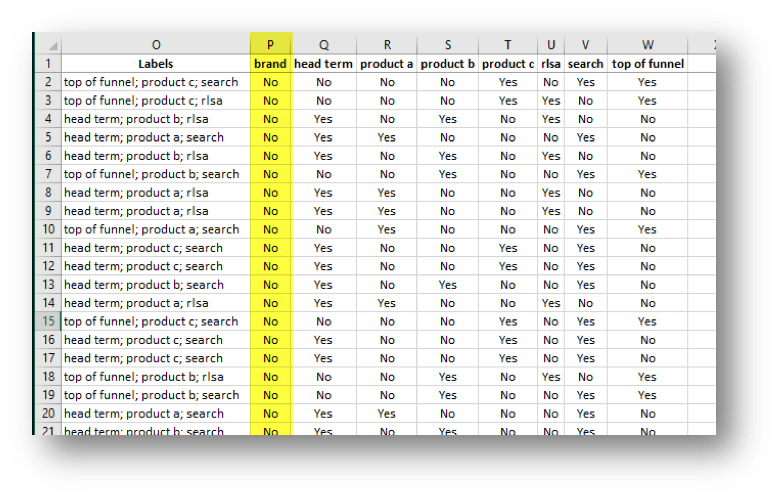
In this case, I have exported the data for one campaign, but you can easily modify the Data tab for any export by adding the required columns. The screenshot below shows how this data is divided into three sections:
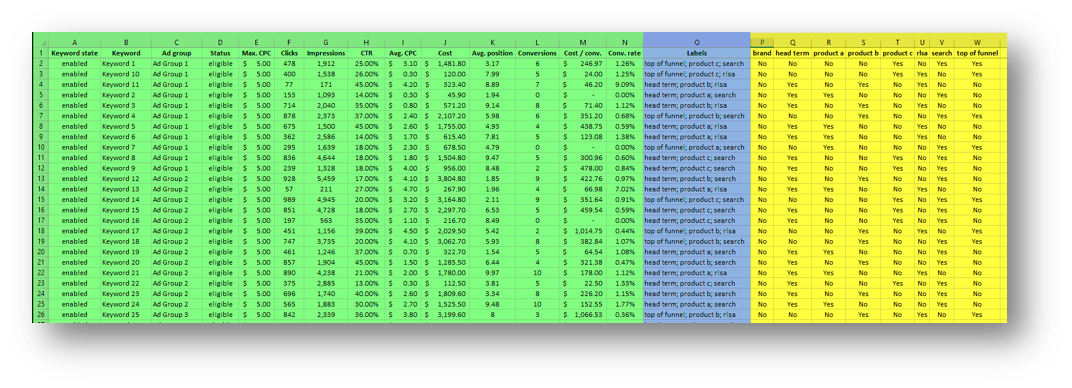
Green: AdWords exported data
Blue: Labels
Yellow: Formulas (and stuff added to but based on the exported AdWords data)
Tab: Data
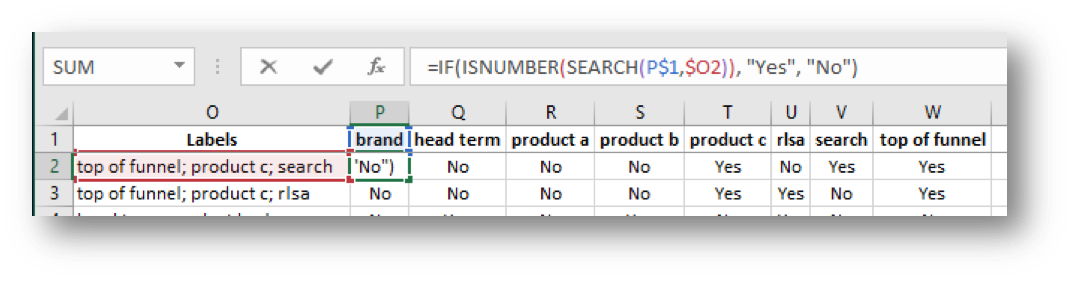
In the close up look at the formula below, what we see is a formula that looks for the character string (cell P1) in the labels column (cell O1). If that formula finds the character string, in this example ‘brand’, it returns the value “Yes”, if it doesn’t find it then it returns “No”. The dollar sign ‘$’ simply fixes that aspect of the cell reference, so that when you copy and paste, it does not change.
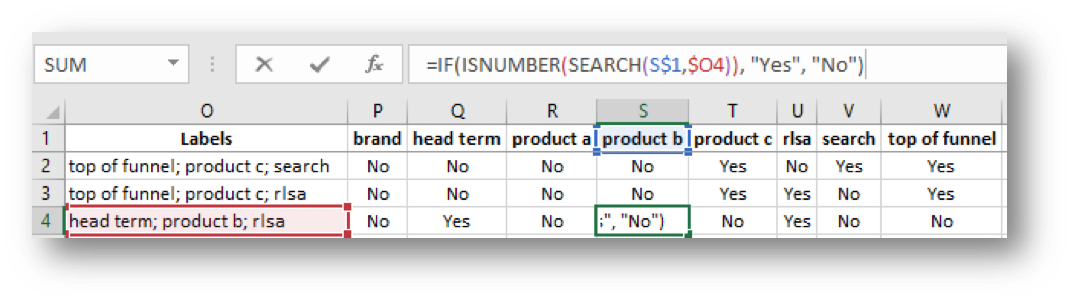
This formula is replicated across all columns and down all rows, for example:
Tab: Analysis
The data in this tab looks like this:

What we see here is the result of the formulas within the cells containing data, this is all based on the SUMIF or SUMIFS formula. In the example below, we can see how this is structured:
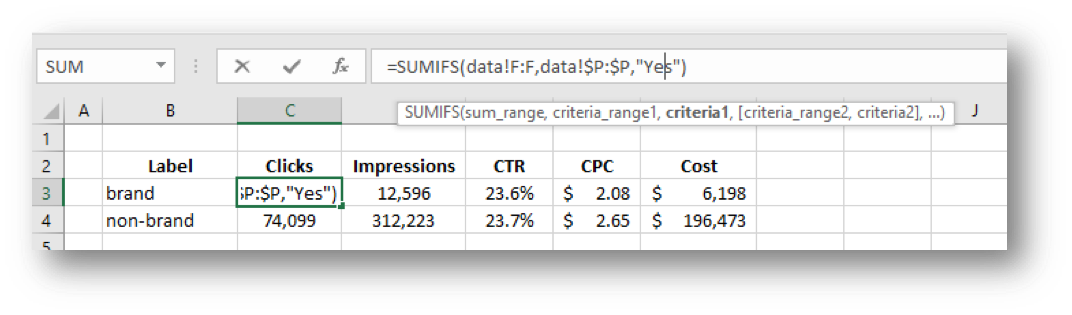
What this formula is saying is; sum any cells in the range of data!F:F where the corresponding cell in the range data!$P:$P contain the word “Yes”. The word ‘data’ in the formula is a reference to the ‘data’ tab, because these formulas look at the data tab values described in the above section.
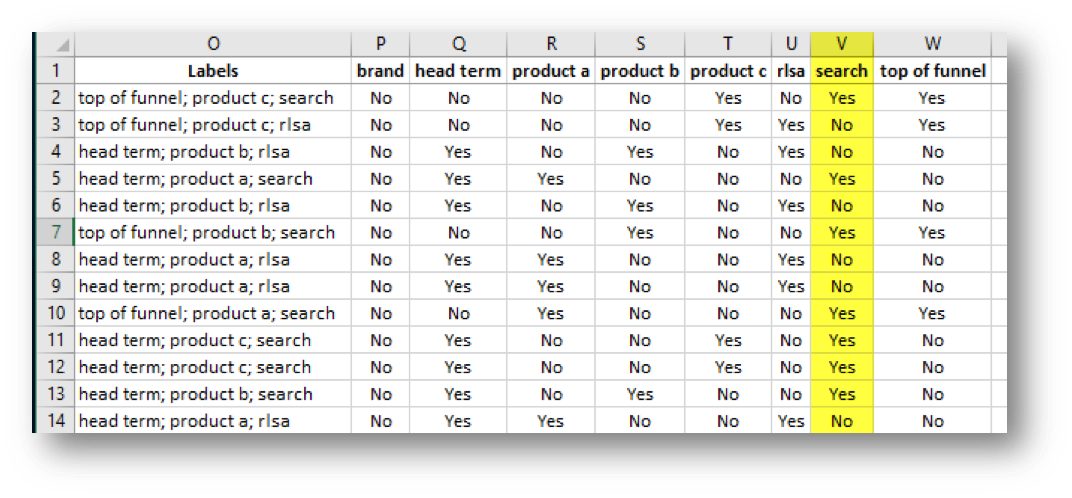
It is important to note that the ‘brand’ label formulas look at the brand column for the word “Yes” in the data tab:
It then follows logically that the ‘head term’ formulas in the analysis tab look at the ‘head term’ column (column Q in the above screenshot) in the ‘data’ tab.
It should also follow logically that the Clicks column sums data from the ‘clicks’ column in the ‘data’ tab and so on.
5. Advanced Segmentation (Labels)
Following on from the above example, we can create much more advanced segmentation using multiple labels to look at specific aspects of the data. In the above example, we show you how to do this with one label, but we deliberately used the SUMIFS formula rather than SUMIF, to make this an easier transition.
Tab: Advanced
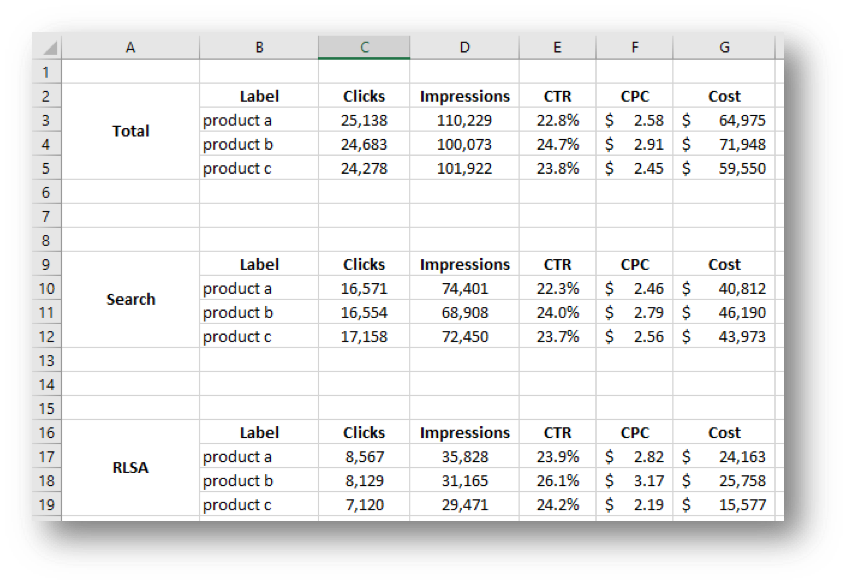
The screenshot of the ‘advanced’ tab shows that we have zeroed in on the product labels, but we have segmented them by the ‘search’ label and the ‘rlsa’ label in the bottom two tables. The top table shows the total for the product labels in the same way already described above.
The closeup of the formula bellows should look familiar, as it is the same as the one shown in the previous section of this guide, but with an extra bit on the end:
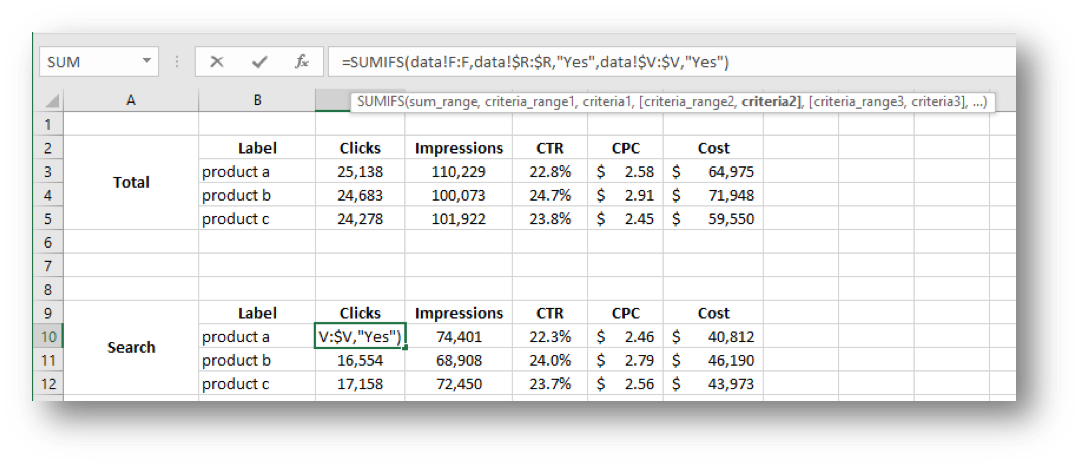
This ‘extra bit’ is an additional criterion, which says that we also need to find a “Yes” in the corresponding cell in column V of the data tab. Column V (see below) is the ‘search’ label column:
This formula is essentially saying that we need a “Yes” in cells in both columns R and V in order to sum the cells in column F: which in this case is the number of clicks that keywords with both the labels ‘product a’ and ‘search’ have received.
You can keep adding criteria to these formulas if you want to segment even further. You can use filters in AdWords to look at custom combinations of labels and you can even save those filter.
But setting it up in Excel like this means that you can just copy and paste the data for the whole account into the sheet and you get to see all of the tables and charts needed to report on or analyze the data. This is easy to send out to people and can be done offline rather than loading web pages.